Just another by-product of my dissertation thesis on Open Science in the Social Sciences: Last saturday (June 14, 2014) I had a look at the ten countries that publish the most Open Access journals and the share of journals charging their authors with article processing charges (APCs) per country. I used the Directory of Open Access Journals DOAJ to gather the information needed and faced some problems: Of course I would have prefered to use the CSV-file offered by the DOAJ, the DOAJ homepage promises that the “csv file is updated every 30 minutes” – in fact it is about five weeks old and was obviously generated at May 7th, that is at least what the file’s name indicates: doaj_20140507_1330_utf8.csv. Accordingly the information within the CSV file was not up to date, it contained information on 9.709 journals. However the DOAJ website told me that it lists 9.834 journals.nnMoreover the CSV file was not usable for my purpose because it did contain a column named Publication Fee, but this column did not contain any information, in fact it was totally empty. So I had to compile the information on Open Access journals per country and the occurence of publication fees by using the DOAJ web interface. The following table gives an impression about the ten countries publishing the largest numbers of Open Access journals. The query via the web interface showed a difference between the total number of journals per country and the sum of journals that either raised no APCs, that did charge APCs or did charge them conditionally. This difference was interpreted as the number of missing values. As we see most of the journals are published in the USA, Brazil (probably mainly via the publication network SciELO) and the UK.nn
nnnnnnnnnnnnnnnnnnnnnnnnnnnnnnnnnnnnnnnnnnnnnnnnnnnnnnnnnnnnnnnnnnnnnnnnnnnnnnnnnnnnnnnnnnnnnnnnnnnnnnnnnnnnnnnnnnnnnnnnnnnnnnnnnnnnnnnnnn
| Country | Number of journals | Missing Values | No information available | Conditional charges (number of journals) | Conditional charges (percentage) | No chargesn(number of journals) | No chargesn(percentage) | Has chargesn(number of journals) | Has chargesn(percentage) |
|---|---|---|---|---|---|---|---|---|---|
| USA | 1.206 | 6 | 33 | 47 | 3,90% | 632 | 52,40% | 488 | 40,46% |
| Brazil | 927 | 21 | 5 | 14 | 1,51% | 845 | 91,15% | 42 | 4,53% |
| UK | 615 | 4 | 4 | 15 | 2,44% | 200 | 32,52% | 392 | 63,74% |
| India | 593 | 3 | 3 | 78 | 13,15% | 254 | 42,83% | 255 | 43,00% |
| Spain | 526 | 10 | 4 | 12 | 2,28% | 480 | 91,25% | 20 | 3,80% |
| Egypt | 461 | 21 | 0 | 0 | 0,00% | 41 | 8,89% | 399 | 86,55% |
| Germany | 338 | 5 | 4 | 4 | 1,18% | 226 | 66,86% | 99 | 29,29% |
| Romania | 299 | 2 | 0 | 6 | 2,01% | 264 | 88,29% | 27 | 9,03% |
| Italy | 292 | 5 | 2 | 6 | 2,05% | 251 | 85,96% | 28 | 9,59% |
| Islamic Republic of Iran | 264 | 8 | 0 | 37 | 14,02% | 193 | 73,11% | 26 | 9,85% |
nn nnResorting the table by the share of journals charging their authors per country gives us some insight in the prevalence of an APC based business modell per country:nn
nnnnnnnnnnnnnnnnnnnnnnnnnnnnnnnnnnnnnnnnnnnnnnnnnnnnnnnnnnnnnnnnnnnnnnnnnnnnnnnnnnnnnnnnnnnnnnnnnnnnnnnnnnnnnnnnnnnnnnnnnnnnnnnnnnnnnnnnnn
| Country | Number of journals | Missing Values | No information available | Conditional charges (number of journals) | Conditional charges (percentage) | No chargesn(number of journals) | No Chargesn(percentage) | Has Chargesn(number of journals) | Has chargesn(percentage) |
|---|---|---|---|---|---|---|---|---|---|
| Egypt | 461 | 21 | 0 | 0 | 0,00% | 41 | 8,89% | 399 | 86,55% |
| UK | 615 | 4 | 4 | 15 | 2,44% | 200 | 32,52% | 392 | 63,74% |
| India | 593 | 3 | 3 | 78 | 13,15% | 254 | 42,83% | 255 | 43,00% |
| USA | 1.206 | 6 | 33 | 47 | 3,90% | 632 | 52,40% | 488 | 40,46% |
| Germany | 338 | 5 | 4 | 4 | 1,18% | 226 | 66,86% | 99 | 29,29% |
| Islamic Republic of Iran | 264 | 8 | 0 | 37 | 14,02% | 193 | 73,11% | 26 | 9,85% |
| Italy | 292 | 5 | 2 | 6 | 2,05% | 251 | 85,96% | 28 | 9,59% |
| Romania | 299 | 2 | 0 | 6 | 2,01% | 264 | 88,29% | 27 | 9,03% |
| Brazil | 927 | 21 | 5 | 14 | 1,51% | 845 | 91,15% | 42 | 4,53% |
| Spain | 526 | 10 | 4 | 12 | 2,28% | 480 | 91,25% | 20 | 3,80% |
nnThis chart makes the differences between the countries even more distinctive:nnn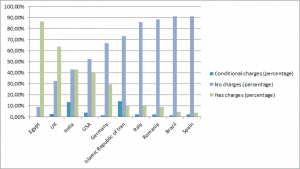 nnSurprisingly Egypt leads this ranking with 86,55% of its Open Access journals charging authors, followed by the UK (presumably reaching this position because of the large number of Open Access journals published by the UK based publisher BioMed Central), India (traditionally suspected to be the country of origin of many predatory Open Access Publishers, that use APCs as an revenue modell but that do not guarantee the quality control of their publications) and the USA. The USA and the UK have always been known to be the home countries of well-known commercial publishing houses and it might be that they are also the home country of many commercial Open Access Publishers. Right away I do not have a explanation for Egypt’s ranking – except the unfounded (and to some extent chauvinstic) idea that the large amount of APC-based journals might hint at a prevalence of predatory publishing, but I emphasize that I do have any evidence for that insinuation.nnBoth data and chart are available under an open license, please cite this information as:nnHerb, U. (2014). Shares of Open Access journals charging publication fees per country. Zenodo. doi:10.5281/zenodo.10480nn
Update: Lambert Heller and Richard Poynder noted in two comments that the high numbers of Open Access journals from Egypt are caused by the activities of the Open Access publisher Hindawi – and of course they are absolutely right. So thanks a lot for that hint Lambert and Richard!nn nnComments:nnLambert Heler: Egypt -> Hindawi Publishers? Anyway thanks for the data, Uli!nnRichard Poynder: Egypt: Hindawi is based in Egypt; Hindawi publishes 434 journals (http://www.hindawi.com/journals/); Hindawi journals charge APCs.nnUlrich Herb: @Richard: Great idea! Of course it would be some (or even a lot of) work. To my mind the data would best be gathered manually or via the journals OAI interfaces (if they have one). One could use the DOAJ as a starting point, in a second step one should identfy the correspondings authors affiliation. If we would also like to know the money spend (and not only the number of articles published under an APC modell), it would be necessary to check the APC conditions on the publishers homepages. You would also need to consider whether the information provided by the DOAJ whether a journal charges APCs are correct. For Sociology I found an incredibly high share of false postives (journals that in fact did not charge their authors, but that – according to the DOAJ’s information – used APCs).nnRichard Poynder: A good candidate for a crowdsourcing project perhaps?nnUlrich Herb: nAbsolutely! The crowd would just strictly have to take heed of the design of the study, but I guess that would be a minor problem.nnWow!ter: I would have expected Nigeria in this graph as well. What would be their position on the graphs?nnUlrich Herb: nDear wow!ter, Nigeria is missing because (according to the DOAJ) it only publishes 38 Open Acceess journals, correction: the DOAJ indexes only 38 Open Access journals from Nigeria that is position 47 in a ranking of the countries with the highest output of Open Access Journals. 29 of these Nigerian journals are charging their authors, 3 are charging them conditionally and 6 that don’t use publication fees. So the share of journals using fees is 76,31%.That means Nigeria would hold position two in table two, but it must be noted that we do not know the shares of APC based journals in the other countries on positions 11 to 46 in a ranking of the countries with the highest output of Open Access Journals.nnDom Mitchell: Hello there, I just wanted to correct a small thing here: “Nigeria is missing because (according to the DOAJ) it only publishes 38 Open Access journals,” Actually, DOAJ only indexes 38 Open Access journals from Nigeria. We are sure that there are many others but they have either never applied to be part of DOAJ, or they were rejected from DOAJ because they didn’t meet the requirements. I am certain that is what you meant but I just wanted to make sure that was clear for wow!ter. Many thanks, DomnnUlrich Herb: @Dom thanks a lot for that correction!
Graduate sociologist, information scientist (PhD degree), associate of scidecode science consulting – De Castro, Herb, Rothfritz GbR, working for the Saarland University and State Library (Germany)